IT Support Stats

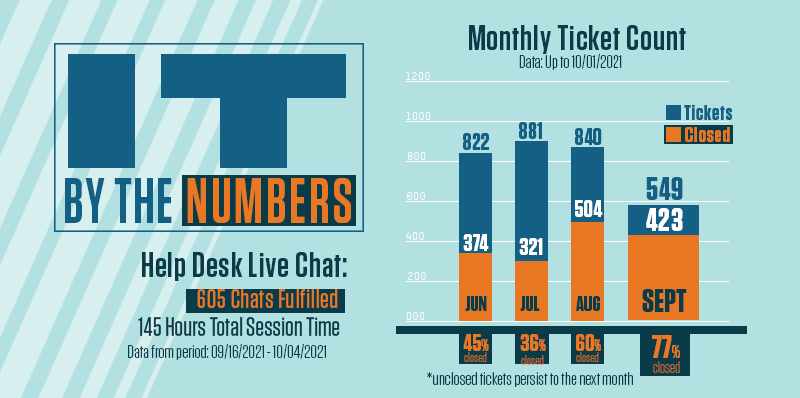
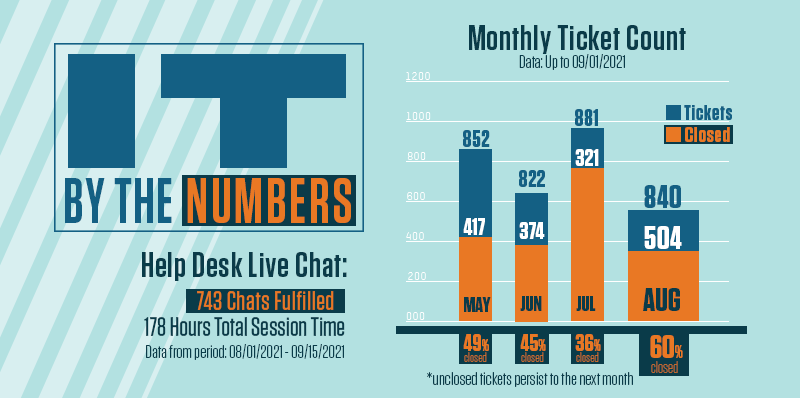
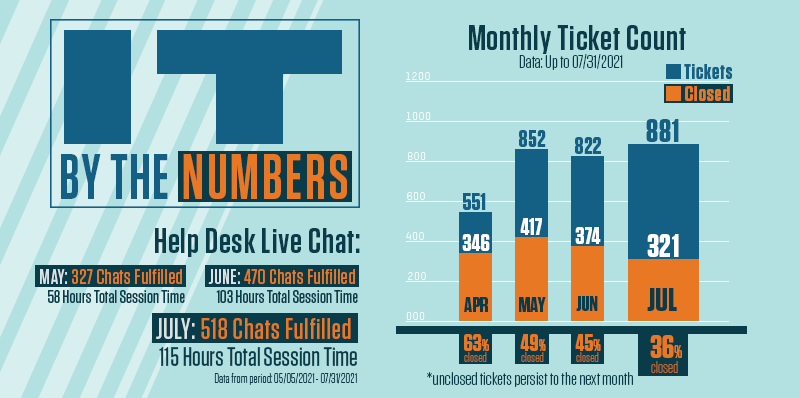
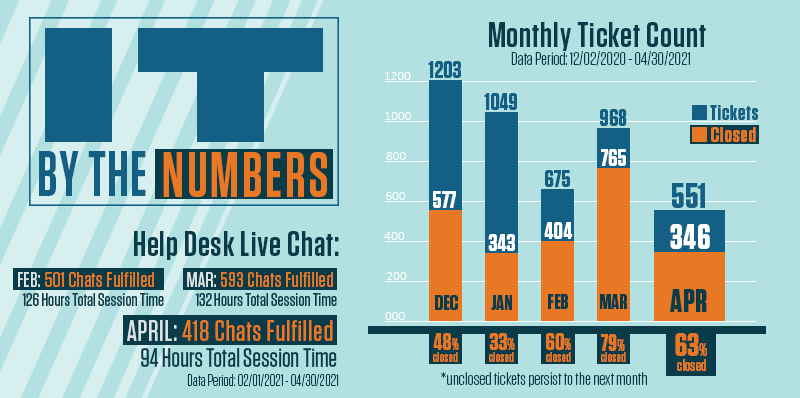
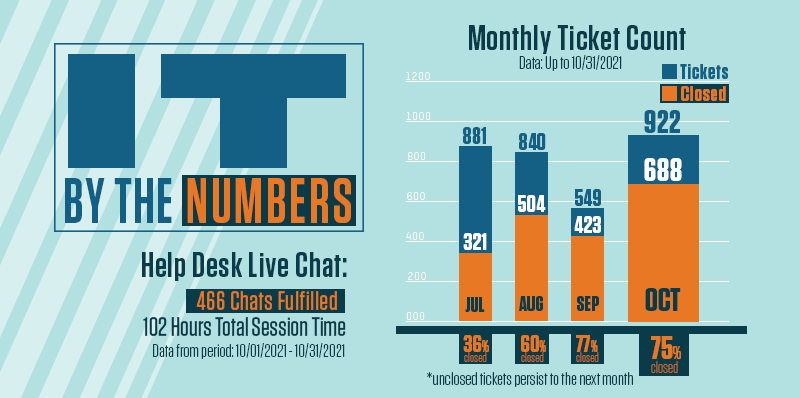
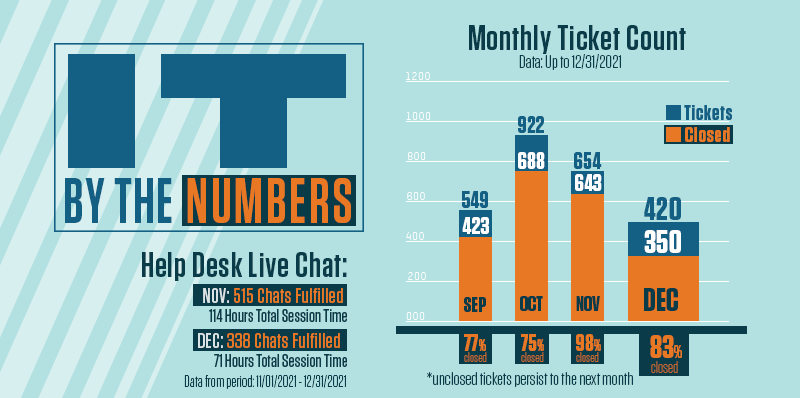
The S&T IT Technology Support Team reports statistics monthly. These statistics provide transparency to campus by showing the team's workload.

To be notified when each newsletter is released and view the most recent statistics please subscribe to the IT Comms blog at https://itcomms.mst.edu/


November-December 2021


Previous Data

Data and graph on S&T IT Support Staff chat and ticket counts. Chat is based on how many are fulfilled and total session times for October 2021. The graph is each month’s total tickets received and total tickets resolved ranging from July - October 2021.

Data and graph on S&T IT Support Staff chat and ticket counts. Chat is based how many are fulfilled and total session times from Feb 2021 to Apr 2021. The graph is each months total tickets received and total tickets resolved ranging from September 2021 to October 2021.

Data and graph on S&T IT Support Staff chat and ticket counts. Chat is based how many are fulfilled and total session times from August 2021 to September 2021. The graph is each months total tickets received and total tickets resolved ranging from May 2021 to August 2021.

Data and graph on S&T IT Support Staff chat and ticket counts. Chat is based how many are fulfilled and total session times from May 2021 to June 2021. The graph is each months total tickets received and total tickets resolved ranging from April 2021 to July 2021.

Data and graph on S&T IT Support Staff chat and ticket counts. Chat is based how many are fulfilled and total session times from Feb 2021 to Apr 2021. The graph is each months total tickets received and total tickets resolved ranging from Dec 2020 to Apr 2021.